Explore Spotify - a data-driven analysis of my Spotify Streaming History
This project is part of the Explore series: a mega-project that I’ve been working on for several months in which I analyze my day-to-day habits through data.
Updated on 8/3/2020 with new data!
Every year, Spotify releases Spotify Wrapped. It’s a combination of both one’s personal streaming habits wrapped into a set of highly customized playlists, as well as playlists containing the past year’s most popular hits across a variety of different genres. It’s a feature completely driven by data collected by the Spotify platform – who’s listening to what – and when – aggregated into a massive database of preferences used to curate the “perfect” playlist.
Thanks to GDPR and the California Consumer Privacy Act, we – as consumers – now have access to the data that Spotify collects on us. Earlier this month, I requested a copy of my data - and proceeded to run an analysis on when I listen to music, what I listen to, and how it fits in with the rest of my life.
I’ve released my code on GitHub – so feel free to request your own data and plug it in! Below is a summary of some interesting visualizations from my analysis.
File Overview
Here’s a summary of the interesting files from this dataset.
| data | description |
|---|---|
| Identity | Not surprisingly, Spotify knows my home address. It’s probably sourced from when I upgraded to Premium - and entered my billing address. |
| SearchQueries | Spotify saves every single search query I’ve ever entered – as well as the time/platform of the query and what I clicked on after I hit search. |
| StreamingHistory | Every single song I’ve streamed over the past year, as well as the endTime, artistName, trackName, and msPlayed. |
Spotify’s data download also includes other information, like a list of tracks you’ve added to your library and playlists you’ve created.
A brief aside: it’s pretty easy to scrape information from your friends’ public playlists through Spotify’s unofficial Web API. If your friends make most of their playlists public, you can throw all of the data into a network graph and create some pretty interesting visualizations based on artist/track overlap. You can also pretty easily make playlists curated to your overlap in music taste!
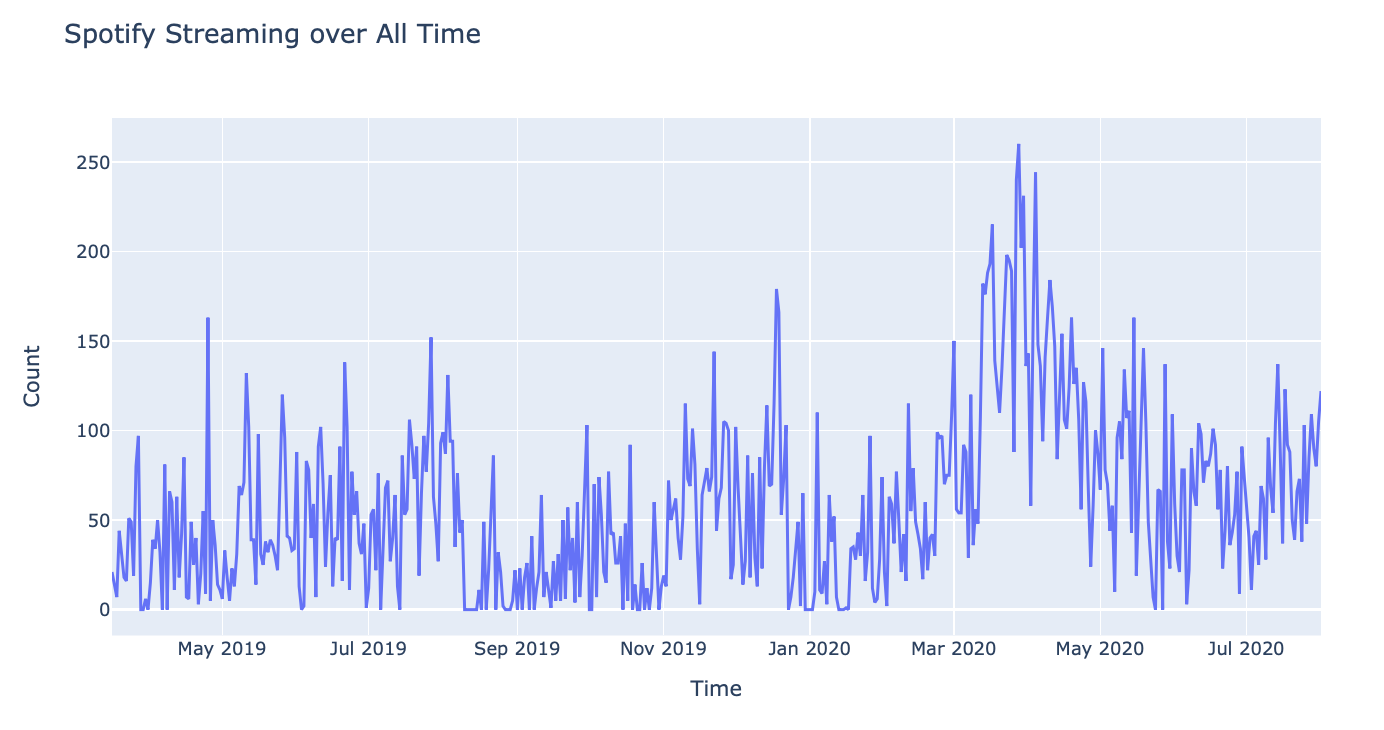
Streaming History over the Past 12 Months
Ok, back to analyzing my own data. To start, I took a look at my streaming over time – from March of last year to the present day. It appears I’ve mostly stayed pretty constant, with a few spikes in June (increased biking & working out during Summer break), December (probably due to long flights), and March (due to shelter-in-place & working from home).
In April and September, the end & start of the school year, I typically more time with people than alone – habits which were reflected in the dip in streaming during those periods.
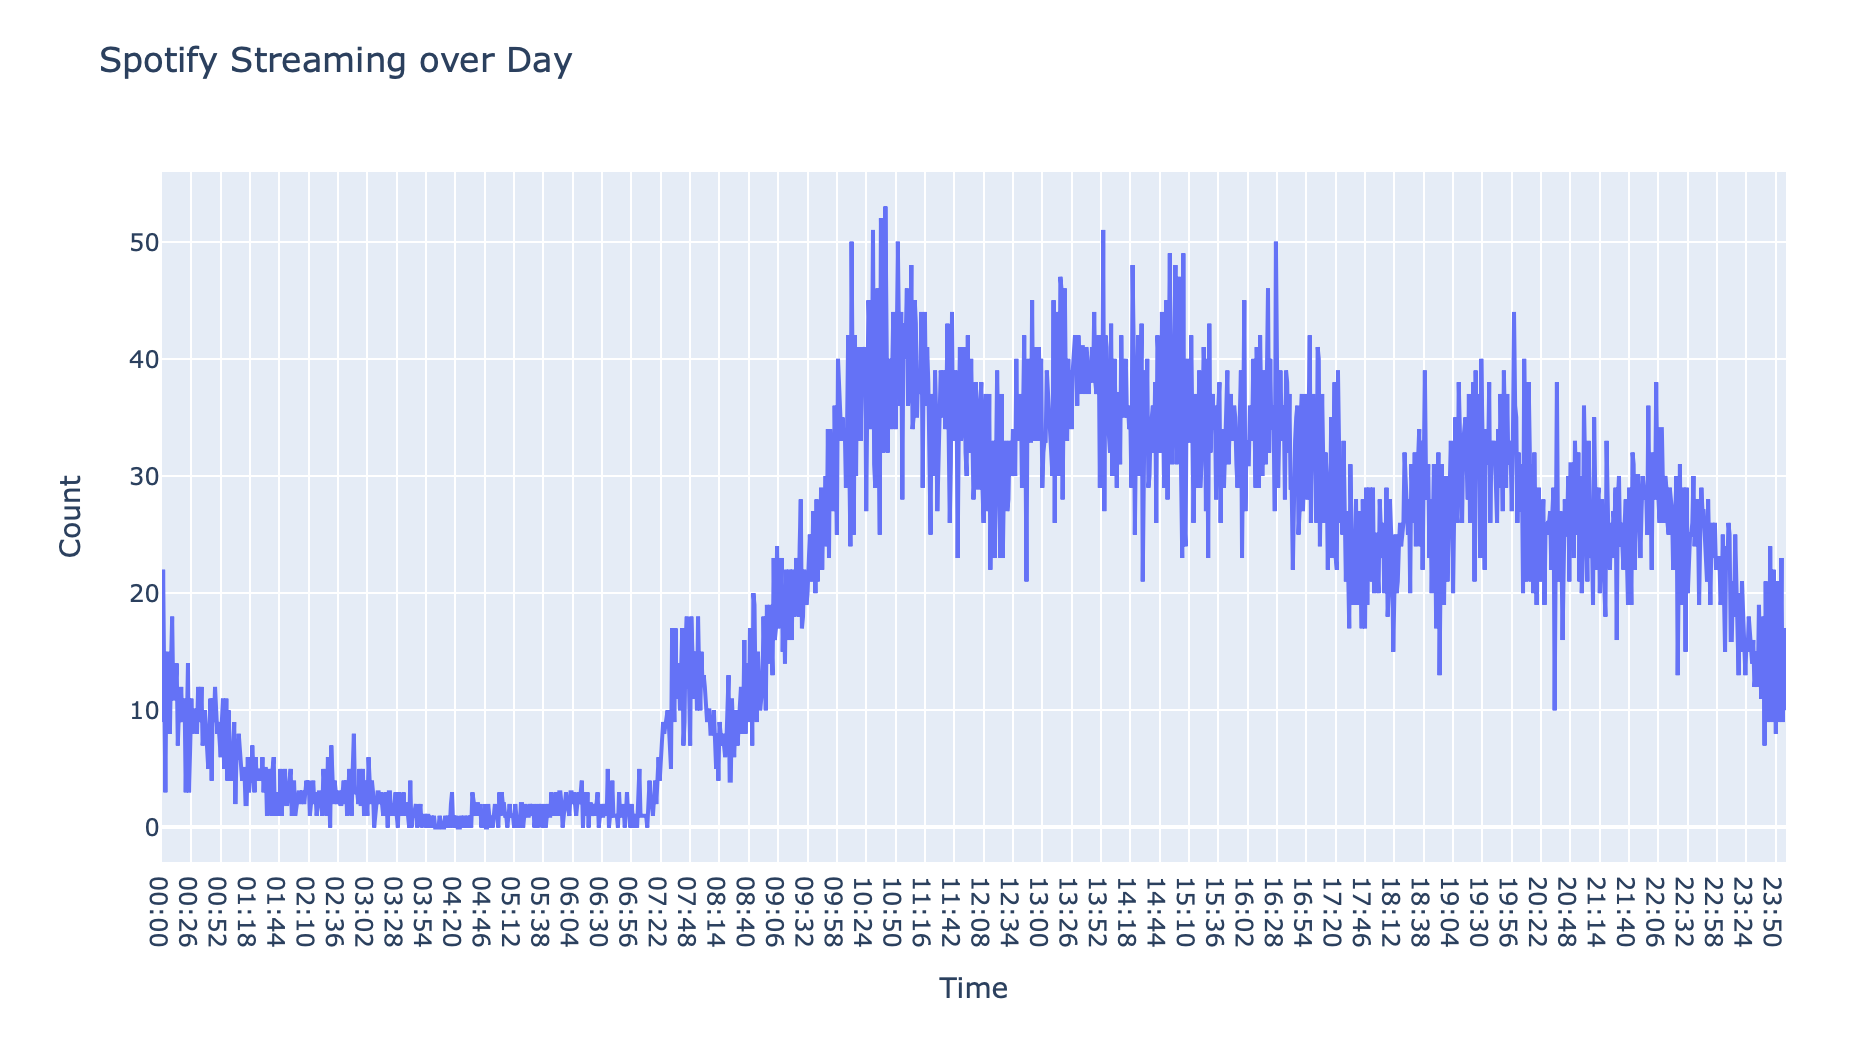
Aggregated Daily Streaming History
My day-to-day habits were pretty as-expected. My streaming gradually increases throughout the day, peaking at 10 AM, 4 PM, and 8 PM – the times I’m most likely studying on my own in a library or cafe.
Most Popular Tracks and Artists
Not much here, other than some aggregated statistics about my top tracks & artists. For reference, 13954157 milliseconds is equal to just under 4 hours.
| Track Name | ms played |
|---|---|
| Another Place | 32173559 |
| Outnumbered | 29362714 |
| Phases | 27054957 |
| Mean It | 26576389 |
| You & Me | 26574604 |
| Breathe | 25794466 |
| Soldier | 24237992 |
| Better | 23220595 |
I’ve listened to over 56 hours of Lauv, followed by a distant 12 hours of Alan Silvestri.
| ARTIST Name | ms played |
|---|---|
| Lauv | 204296202 |
| Bastille | 150401342 |
| OneRepublic | 149374250 |
| ILLENIUM | 86868143 |
| Kygo | 83514507 |
| Avicii | 81348055 |
| Coldplay | 78151513 |
| Why Don’t We | 75756793 |
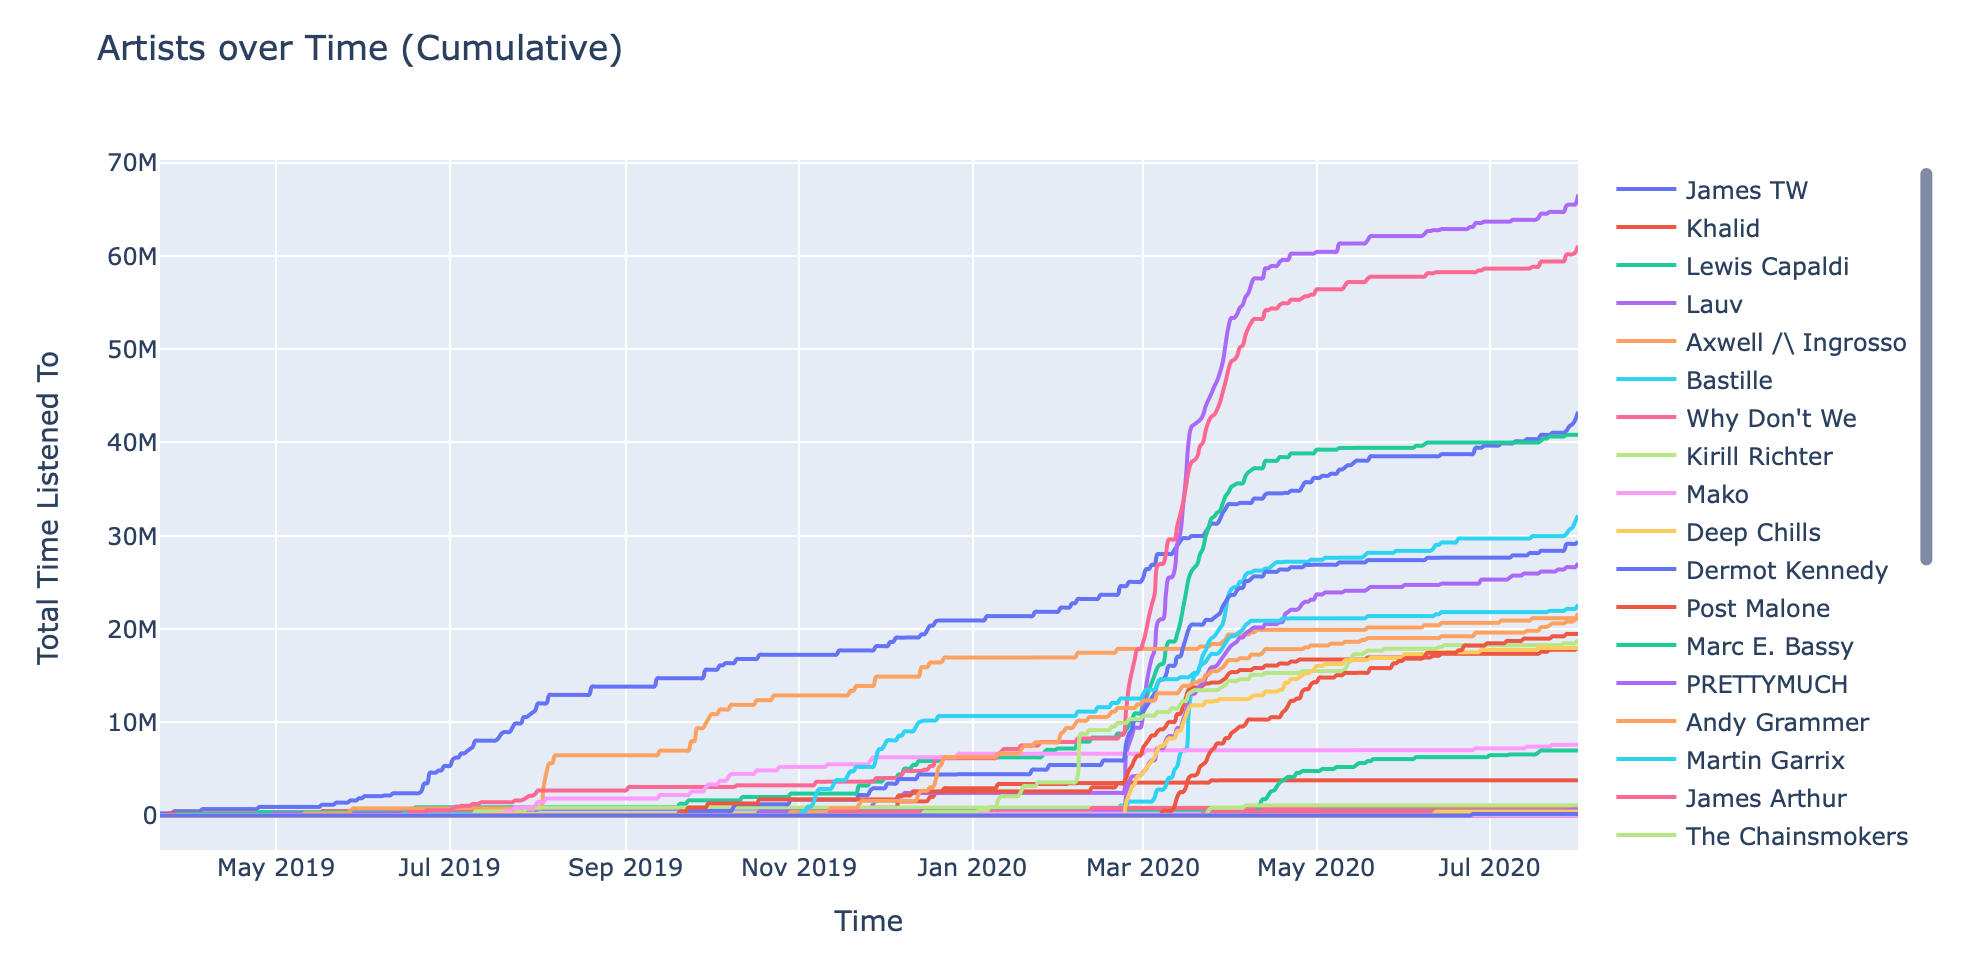
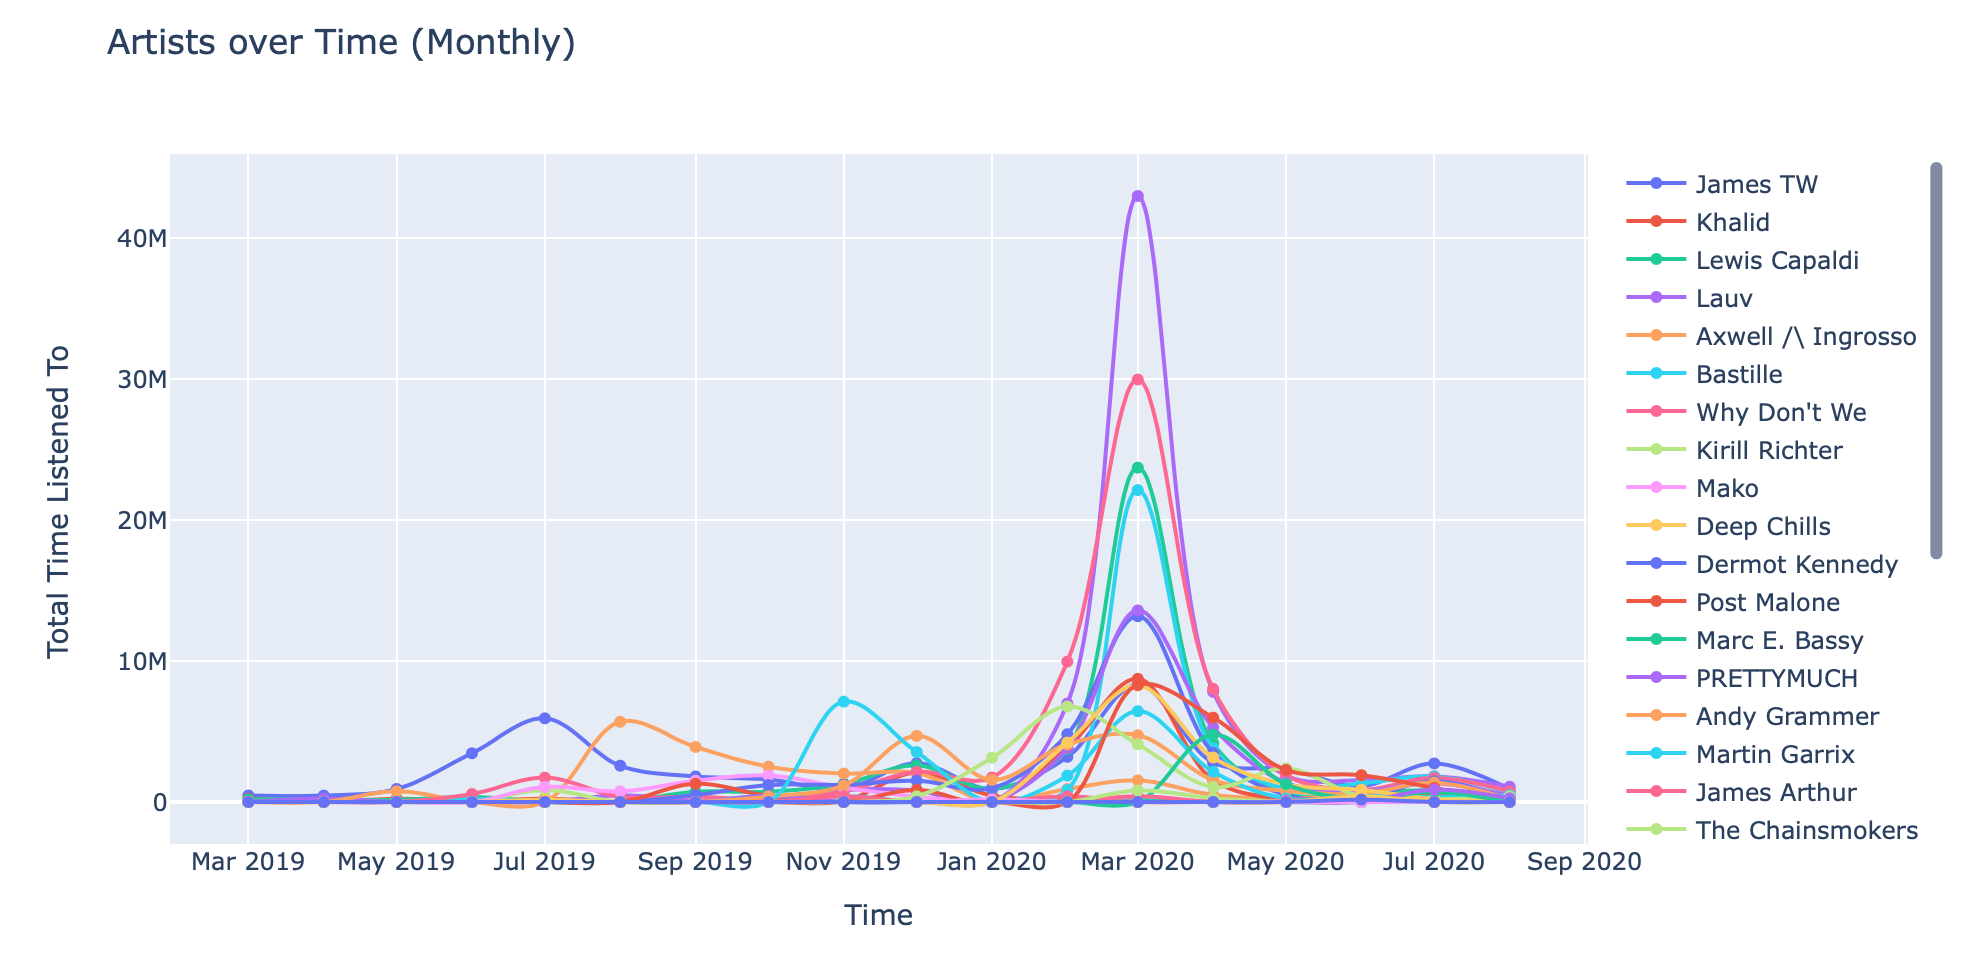
Artists over Time – Cumulative & Monthly
These graphs are pretty interesting. The first one is a cumulative/incremental perspective, whereas the second one is a monthly perspective.
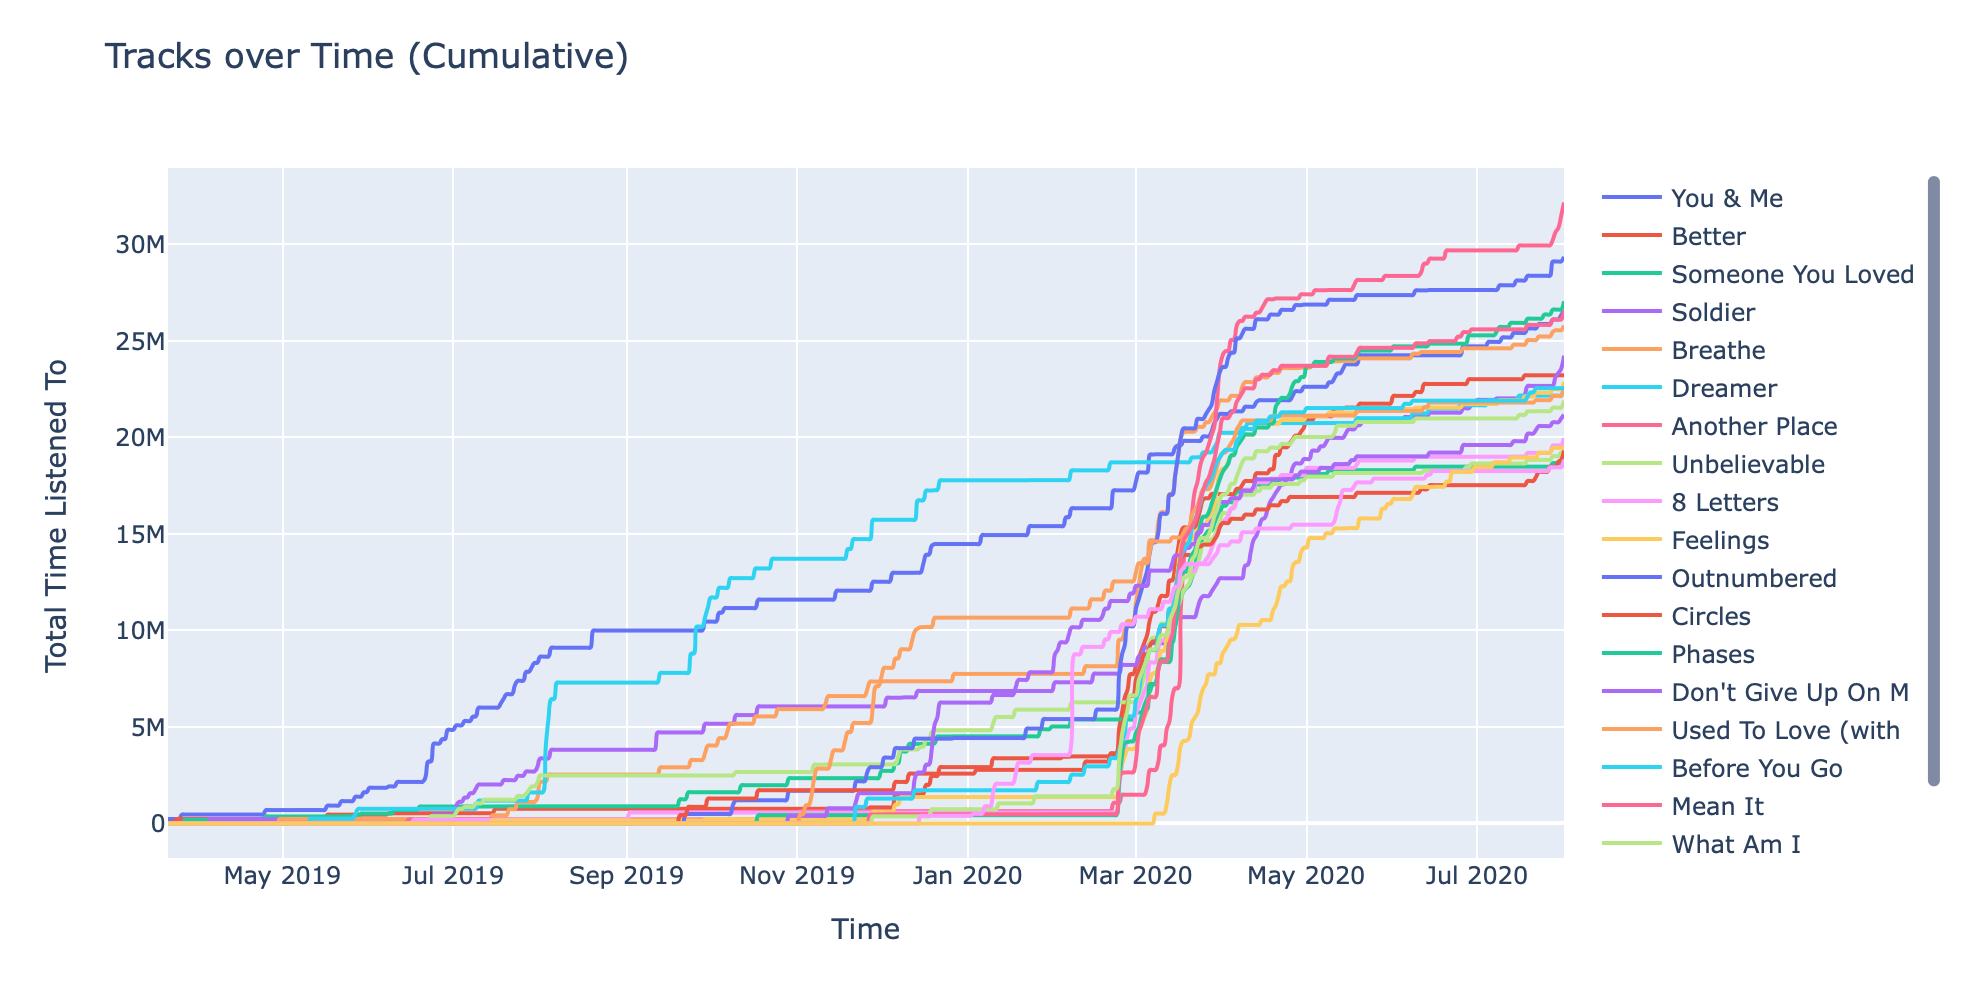
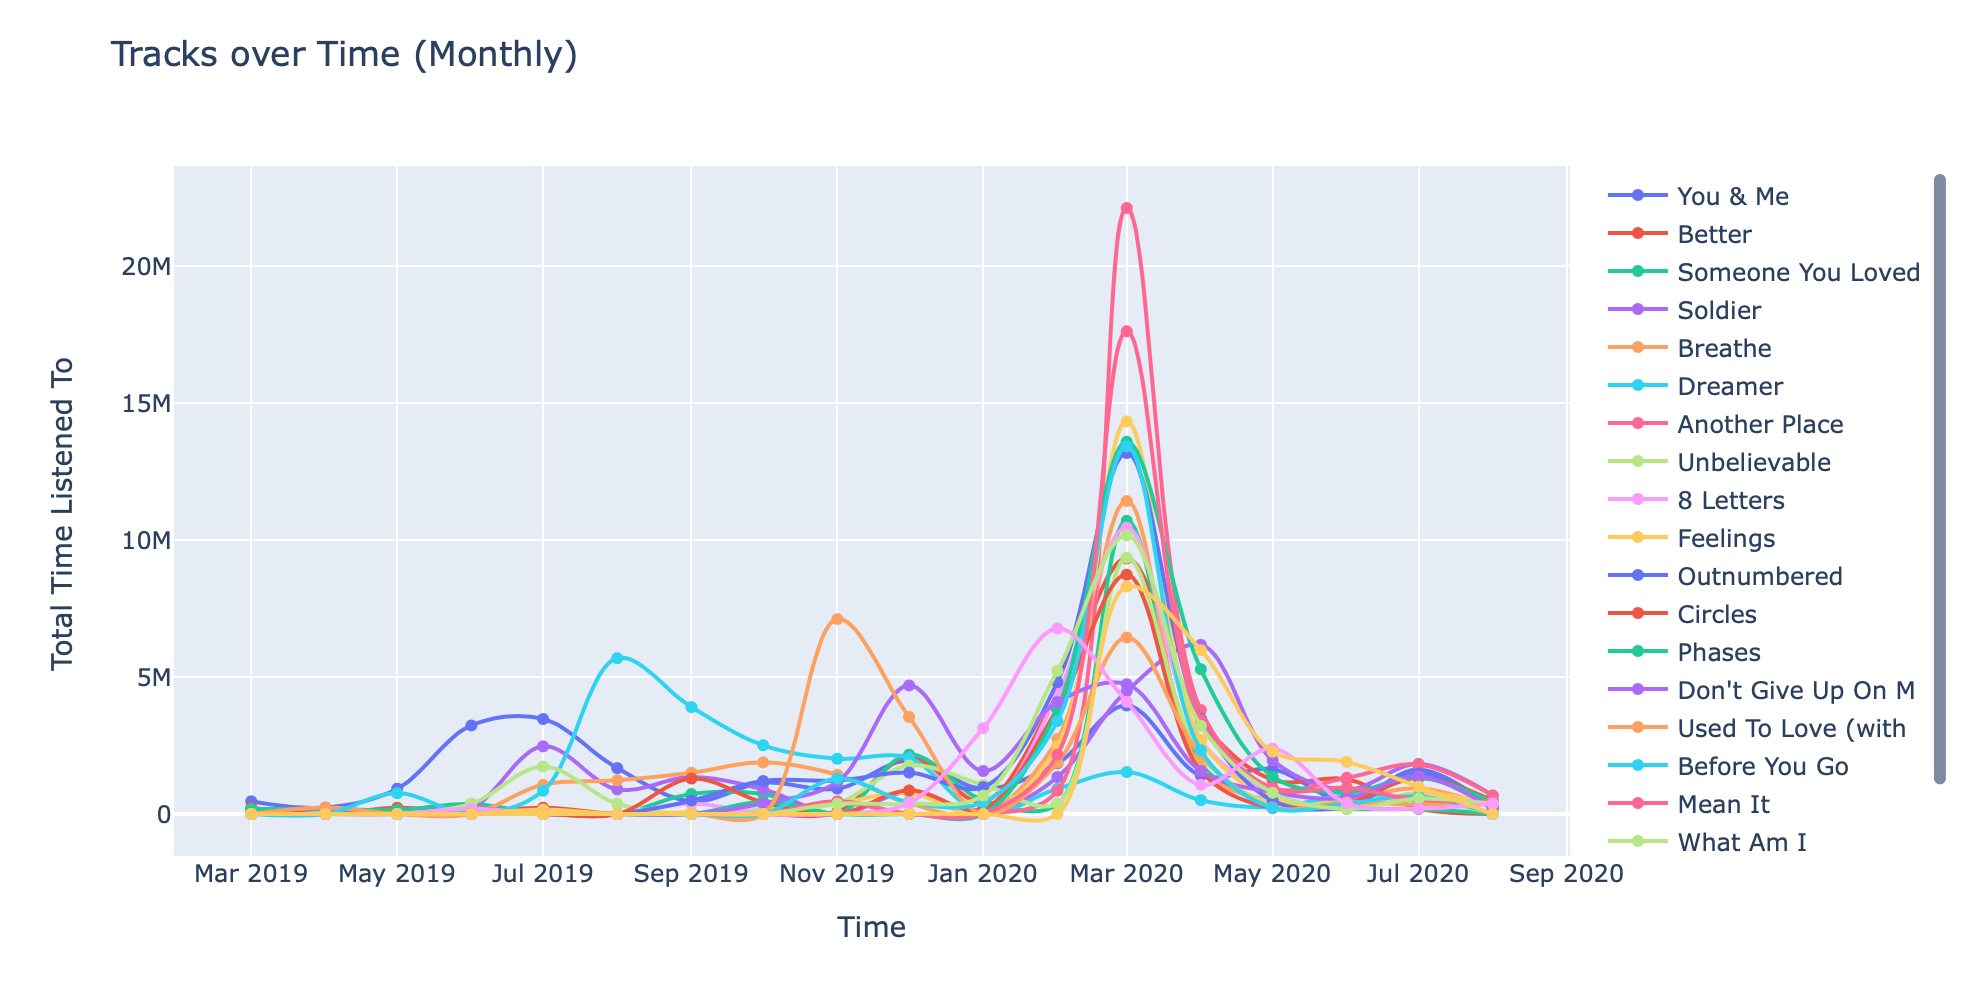
Tracks Over Time – Cumulative & Monthly
These are in the same format as the ones above, but these are for tracks (the ones above were for artists). Note how some tracks consistently increase (i.e. You & Me, by James TW) whereas other tracks shoot up towards the end (i.e. Feelings, by Lauv).
This monthly perspective is much more useful at identifying songs that I listened to consistently during particular months. Example: Illenium’s Beautiful Creatures – over 6M milliseconds in May 2019 alone!
EXTRA: Heartbeat Correlation
My work on Paz (read more here) inspired me to look for connections between music & heart rate. In other words, I wanted to connect my passively and actively collected heart rate information from my Apple Watch – and the music I was listening to during those time periods.
To extract my Apple Watch heart rate data, I exported all health records from my iPhone – then wrote a quick parser to extract that information & create time blocks in which my watch had a heart rate measurement for. I then isolated periods of time where I was listening to music and had a heart rate measurement for, and created some quick visualizations from the merged dataset.
This information could be used to predictively queue up music that I tend to listen to while performing different activities. For example, when I’m running or biking – and my heart rate is higher than normal (say, > 160 BPM) – I listen to more intense and/or upbeat artists like Alan Silvestri, The Vamps, and Panic! At the Disco. When I’m studying, I listen to James TW & other more chill artists.
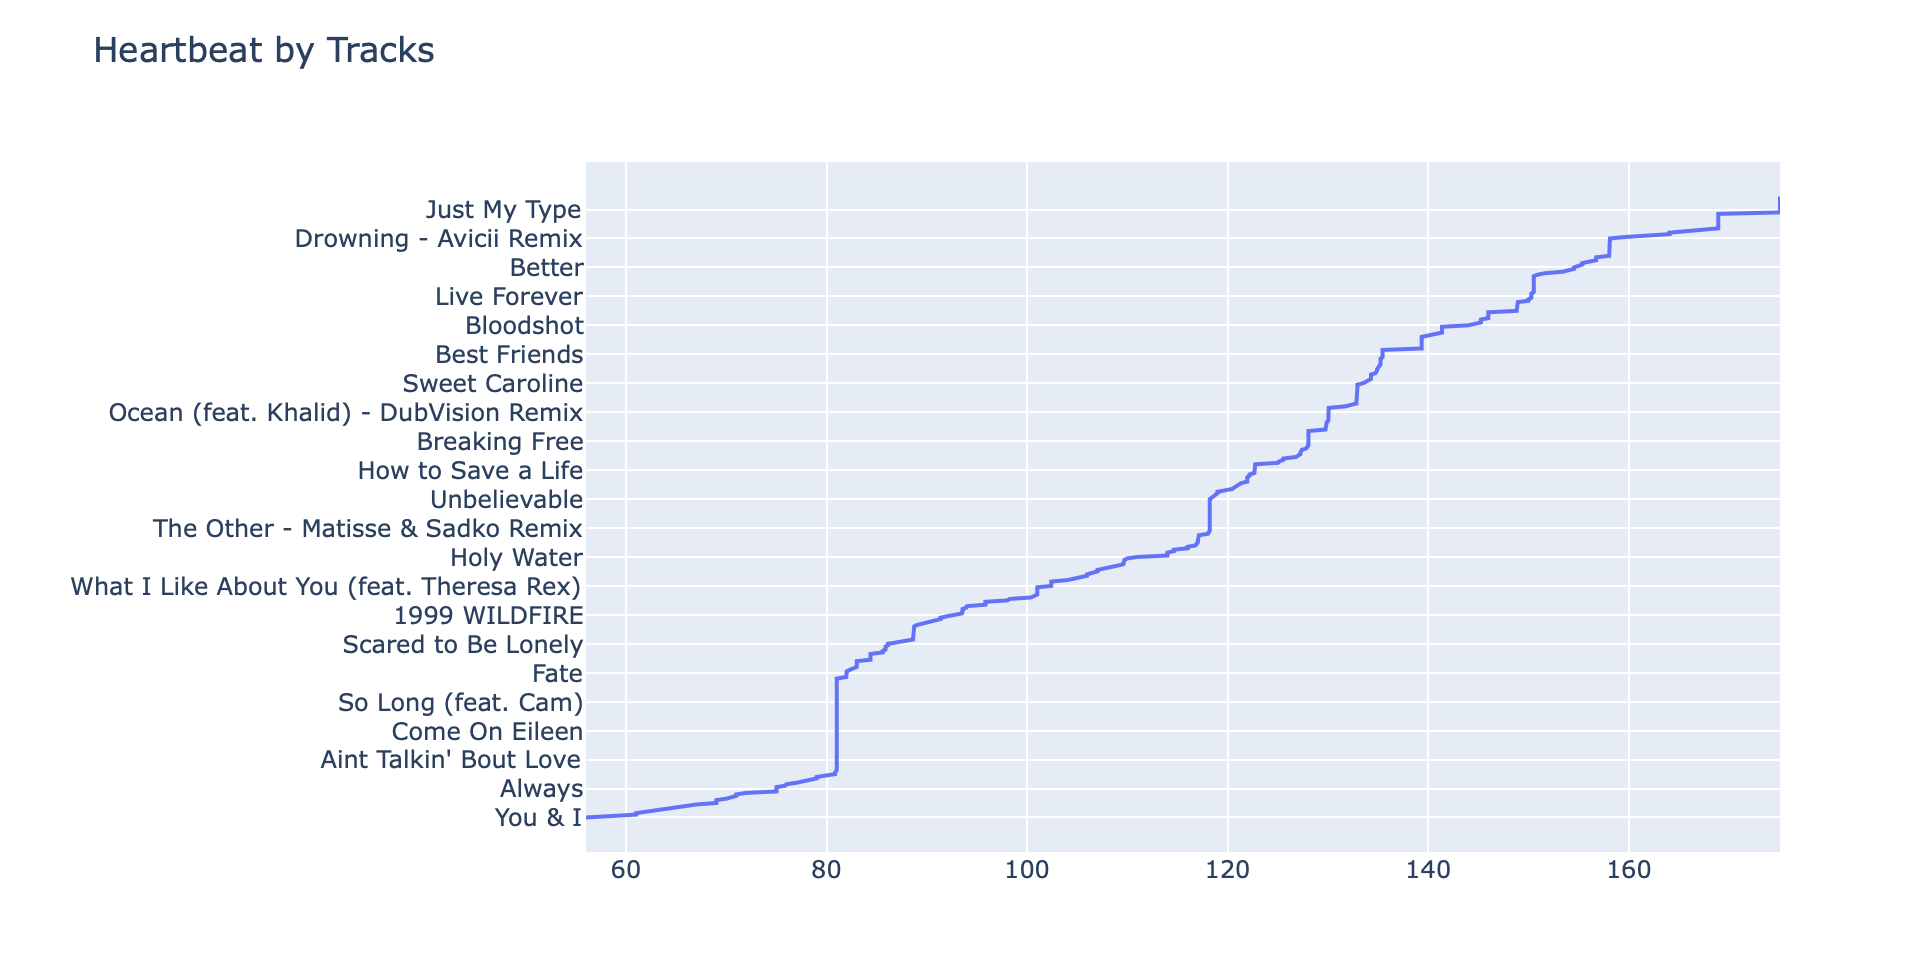
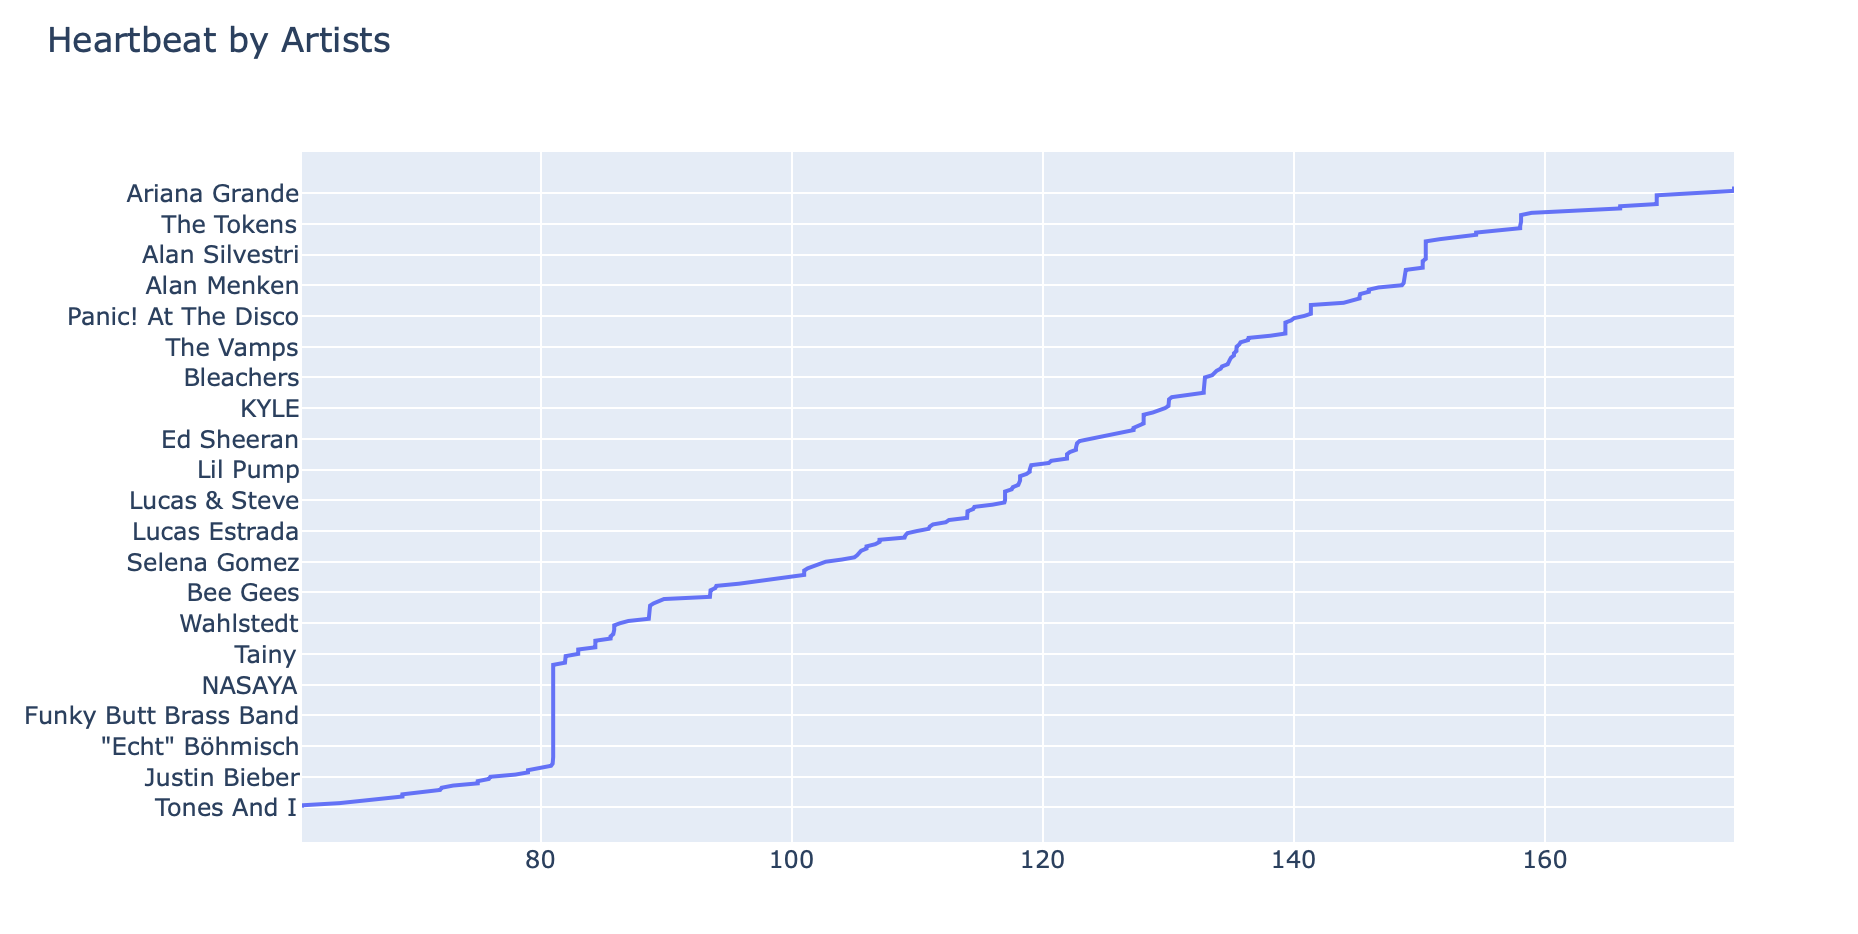
One key issue with this approach: BPM is heavily skewed by the number of times I listened to a particular artist and/or track. For example, songs that I listen to a lot may have lower average heartbeats since my overall average heartbeat is probably around a resting heart rate of 60-65.
| track | average heartbeat |
|---|---|
| Everywhere - 2017 Remaster | 175.06 |
| SOS (feat. Aloe Blacc) | 175.06 |
| Just My Type | 175.06 |
| … | … |
| FRIENDS | 62 |
| Dance Monkey | 61 |
| All You Need To Know (feat. Calle Lehmann) | 61 |
| Guiding Light | 61 |
| artist | average heartbeat |
|---|---|
| BANNERS | 175.06 |
| TOTO | 175.06 |
| Lord Huron | 175.06 |
| … | … |
| The Blue Notes | 66 |
| Paul Cesar | 64 |
| Mumford & Sons | 61 |
| Tones And I | 61 |
Ultimately, this isn’t the best correlation of this information to draw actionable insights from – but nevertheless, it’s still pretty cool to combine two completely isolated data sources in a meaningful way!